Market Sizing
I created an interactive dashboard to facilitate with market sizing. Here is a static image of the dashboard:
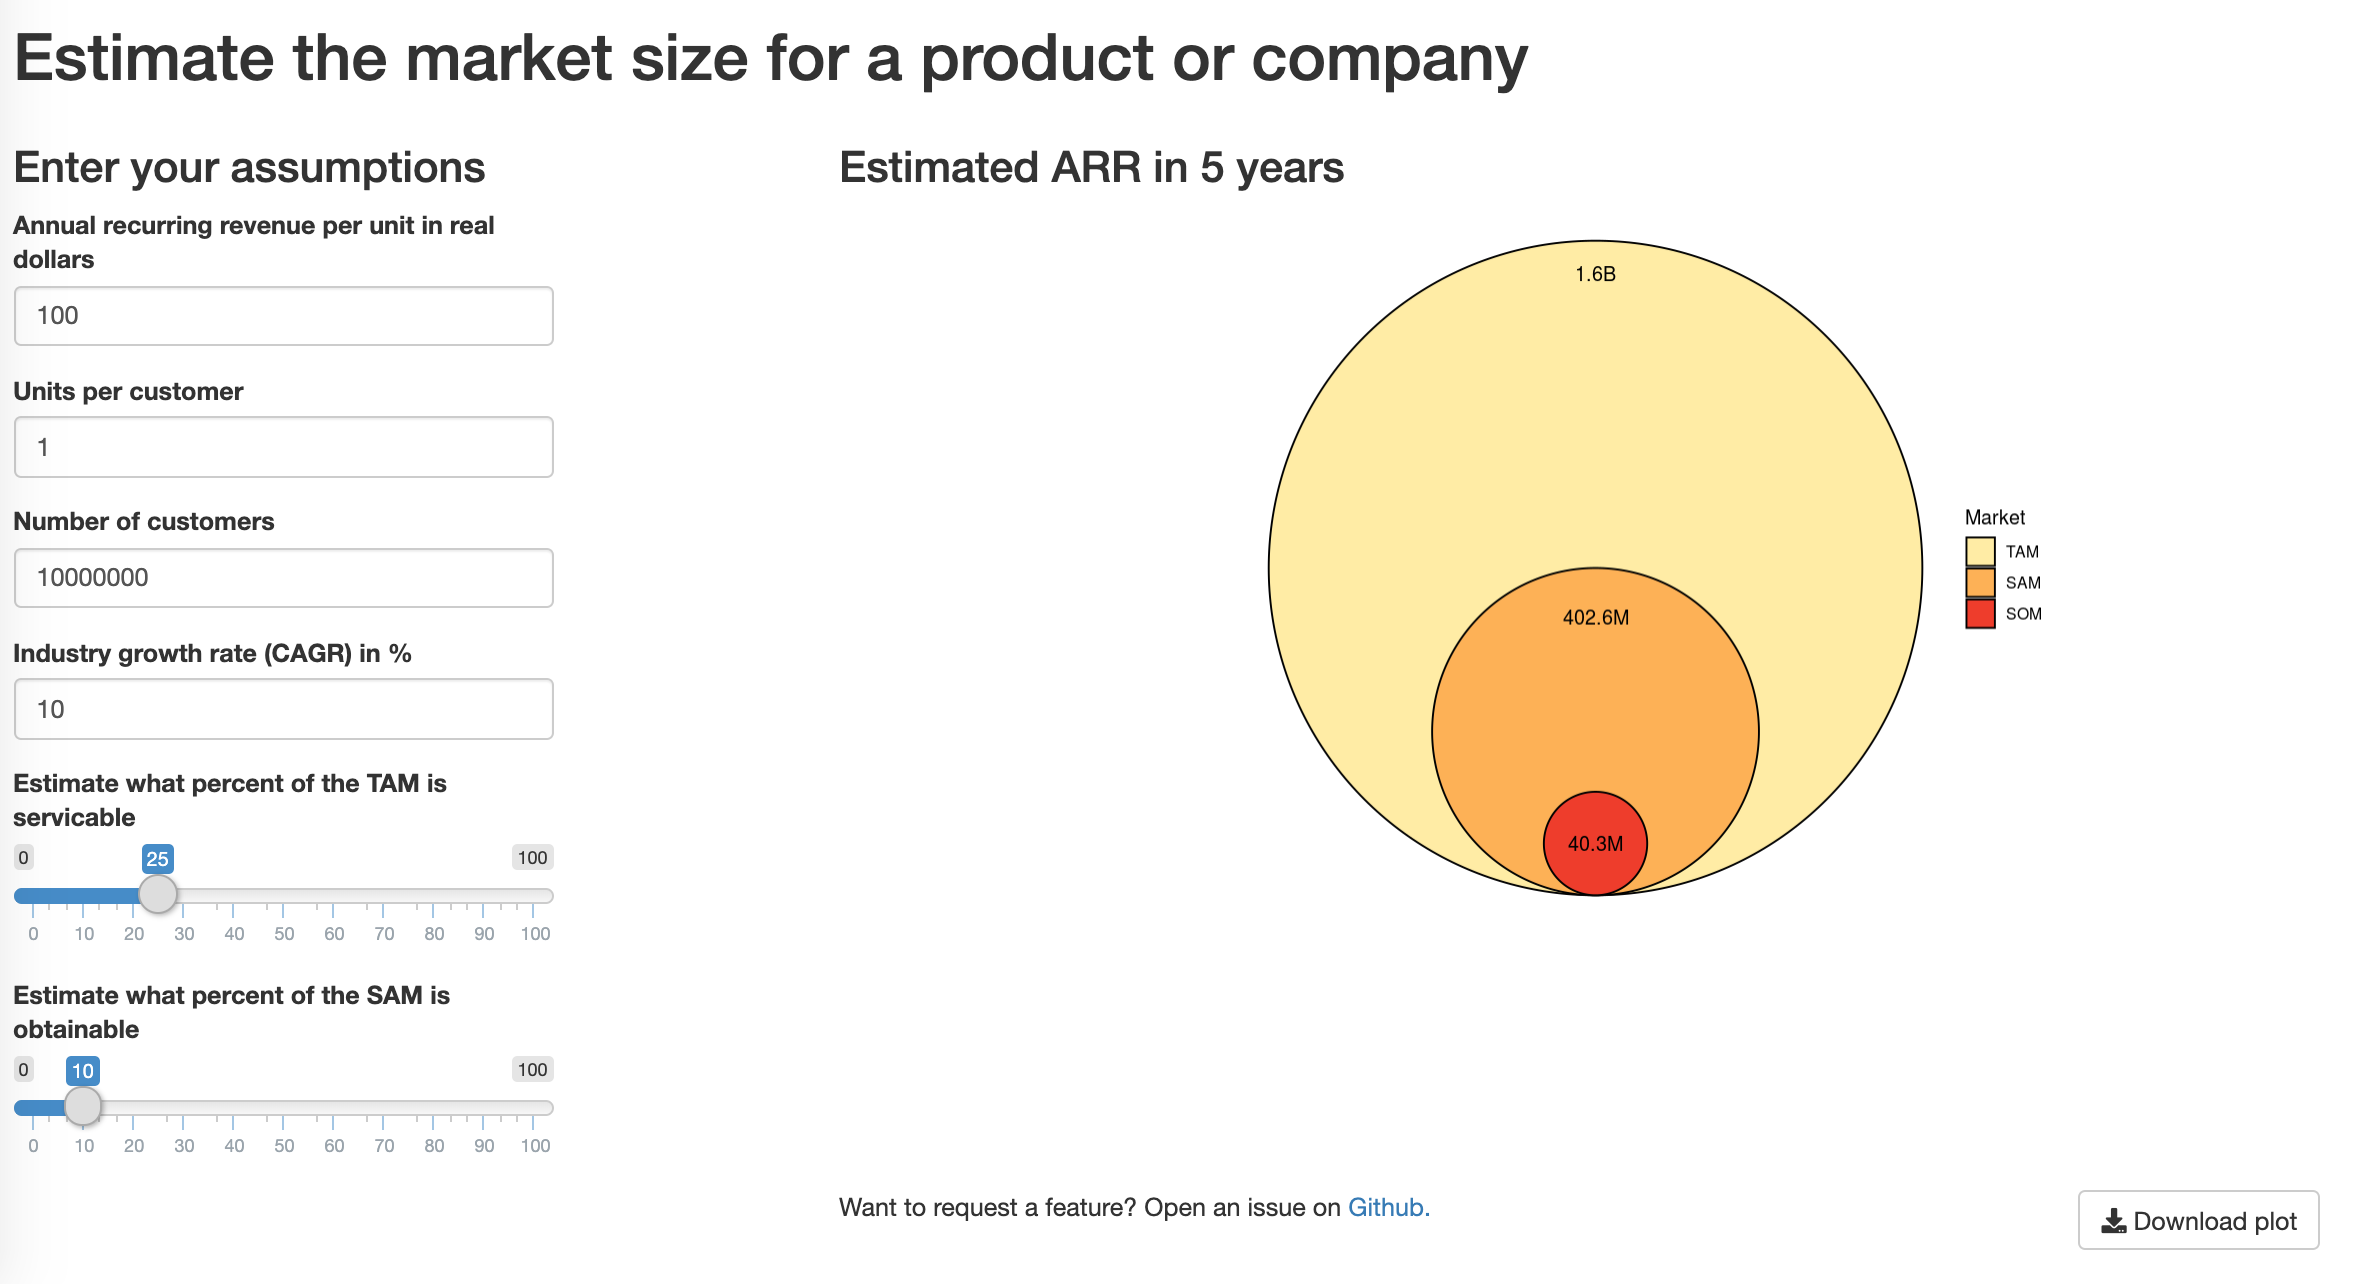
Users can estimate the market size of a product, company or industry using a bottom up approach. The dashboard dynamically generates the plot with the relative sizes of the total available market (TAM), serviceable available market (SAM), and serviceable obtainable market (SOM). Users can download a .png of the plot.
This dashboard was created to streamline market sizing efforts I undertake as a member of the University of Michigan’s Wolverine Venture Fund.
The dashboard was created using the shiny package in R. If you use R, but haven’t tried to make a shiny app yet I recommend that you give it a try. Some of the formatting seems clunky compared to base R, but there are great tutorials so it won’t take too long to implement a simple app.